Project Name
I'm a paragraph. To update me, go to the Data Manager. The Data Manager is where you store and collect data for your site.
Farming 2049
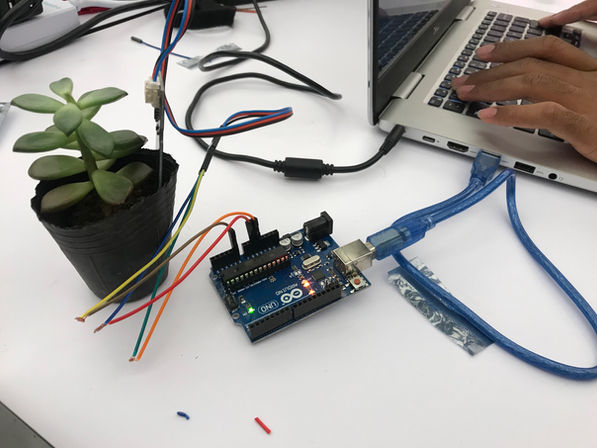
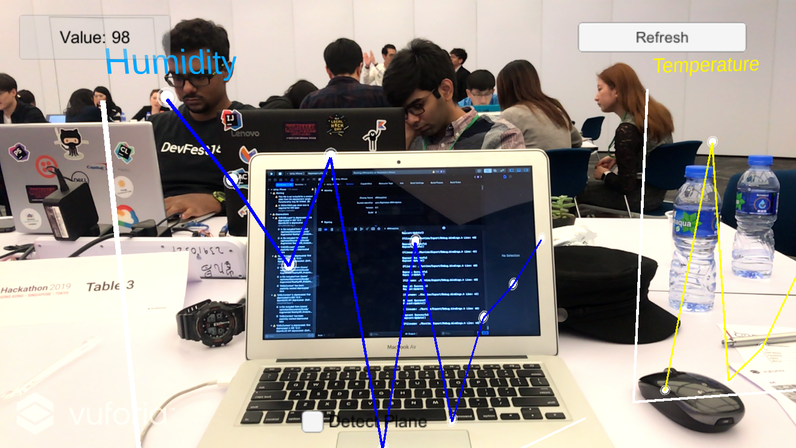
Visualisation of IoT sensor data in Augmented Reality for smart farming applications. Get instant access to Humidity, Temperature and Soil Moisture data via interactive graphs.
The graphs reflect three parameters i.e humidity, temperature and soil moisture content of the plant in real-time. The graphs acquire the data from IoT sensors embedded in the plant. Visualization in AR provides instant access and helps have a better understanding of the data in smart farming solutions. Another implication would be that farmers can monitor their crops by just scanning the unique marker for a specific crop and have all the right data right in front of them. With this data, they can form a more accurate judgment on how much water/fertilizer a crop needs and thereby reducing wastage and improving efficiency.


